African Energy Industry: Simplifying Data Exchange and Visualization

Sonaroid is a SaaS platform that provides near-real-time data and analytics in the energy industry across Africa. It offers consumers access to datasets, reports, maps, and dashboards to enhance business decision-making. Additionally, it enables contributors to submit valuable data to the platform while earning revenue for their contributions.
Problem Statement
Energy industry stakeholders in Africa struggle with accessing reliable, real-time, and structured data to support their decision-making processes. Sonaroid aims to bridge this gap by offering:
A centralized repository of data and reports.
A seamless contributor onboarding process to ensure data authenticity.
Analytical tools such as interactive maps and dashboards.
A secure payment and wallet system for contributors and consumers.
User Personas
1. The Consumer
Profile: Business owners, researchers, and analysts in the oil, gas, and renewable energy industries.
Needs: Access to high-quality data, analytics, and reports for strategic decision-making.
Pain Points:
Difficulty finding reliable datasets.
Lack of industry-specific insights.
Limited access to real-time updates.
2. The Contributor
Profile: Data analysts, researchers, and industry professionals with access to datasets.
Needs: A platform to share data, get recognition, and earn revenue.
Pain Points:
Lack of a centralized platform to contribute industry-specific data.
Unclear contribution validation processes.
No structured earning system for data contributions.
3. The Administrator
Profile: Platform managers responsible for maintaining data integrity and user experience.
Needs: Tools to manage users, approve contributions, and ensure data quality.
Pain Points:
Managing a large volume of data submissions.
Ensuring contributor compliance with data standards.
Monitoring platform usage and engagement.
Designing the Solution
1. Research and Discovery
We conducted interviews with potential consumers and contributors to identify their primary challenges. Competitor analysis was also performed to determine industry gaps. The insights gathered influenced the design of Sonaroid’s core functionalities.
2. Information Architecture & User Flows
We structured the platform around key modules:
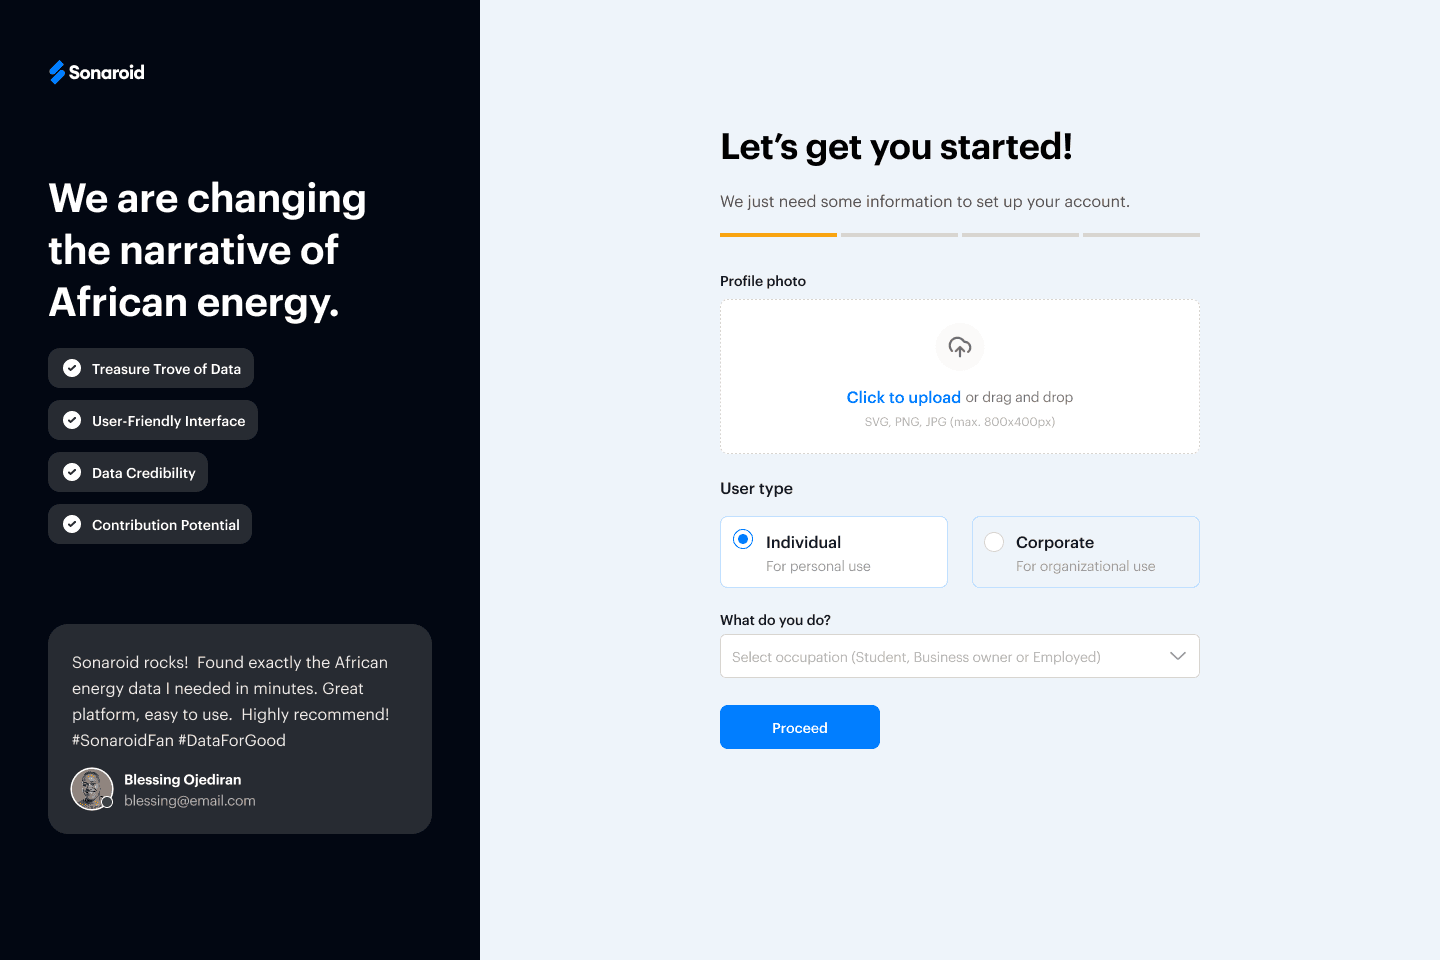
Authentication Module: Seamless onboarding for consumers and contributors.
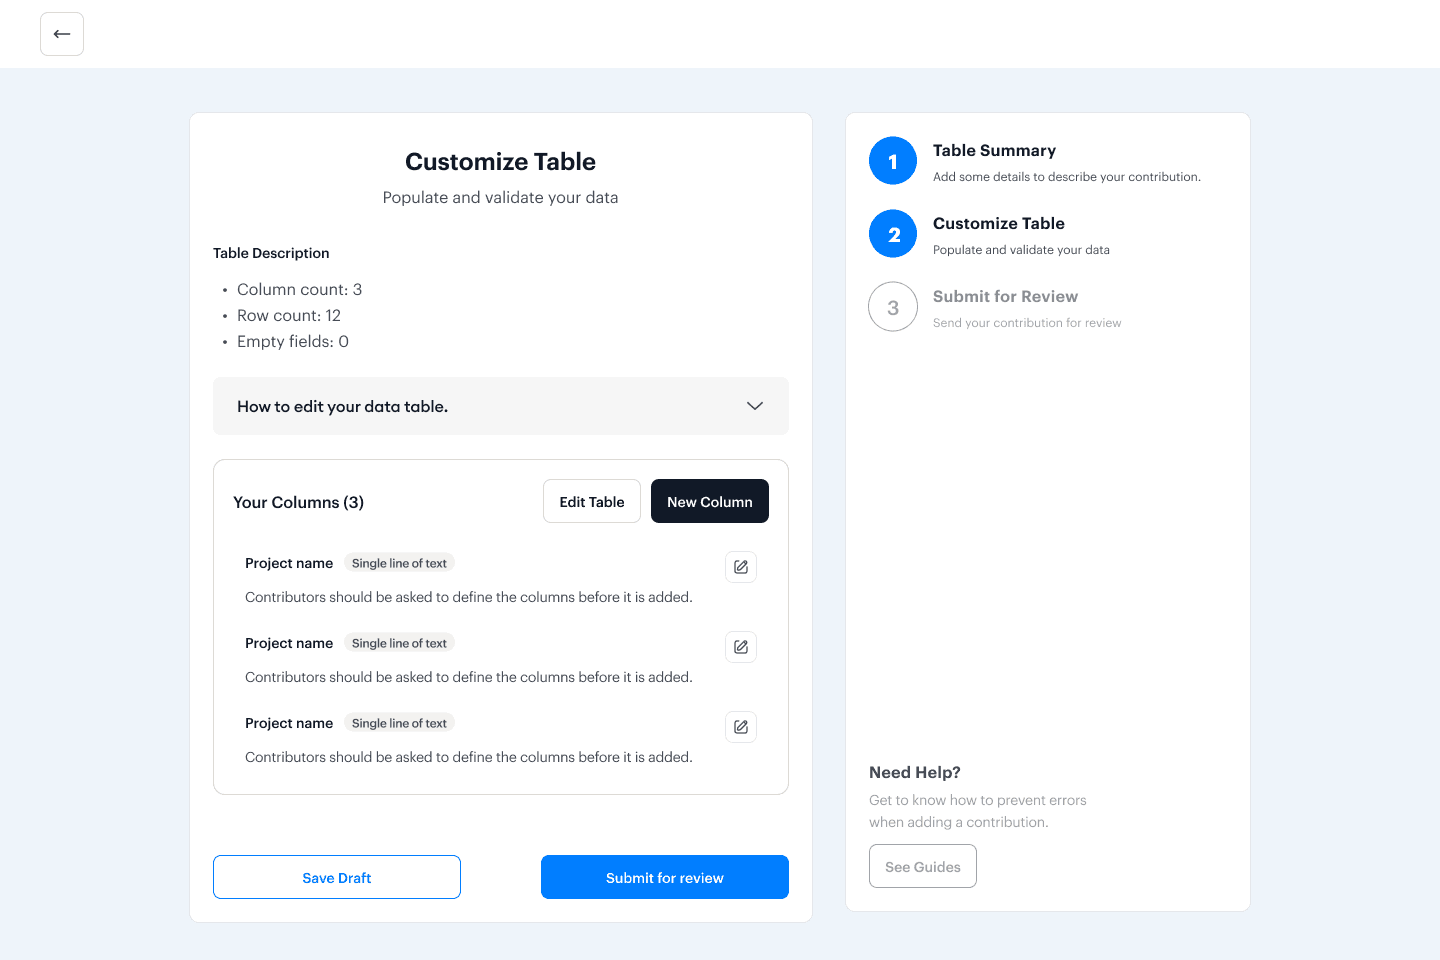
Data Module: Central hub for data collection, validation, and usage.
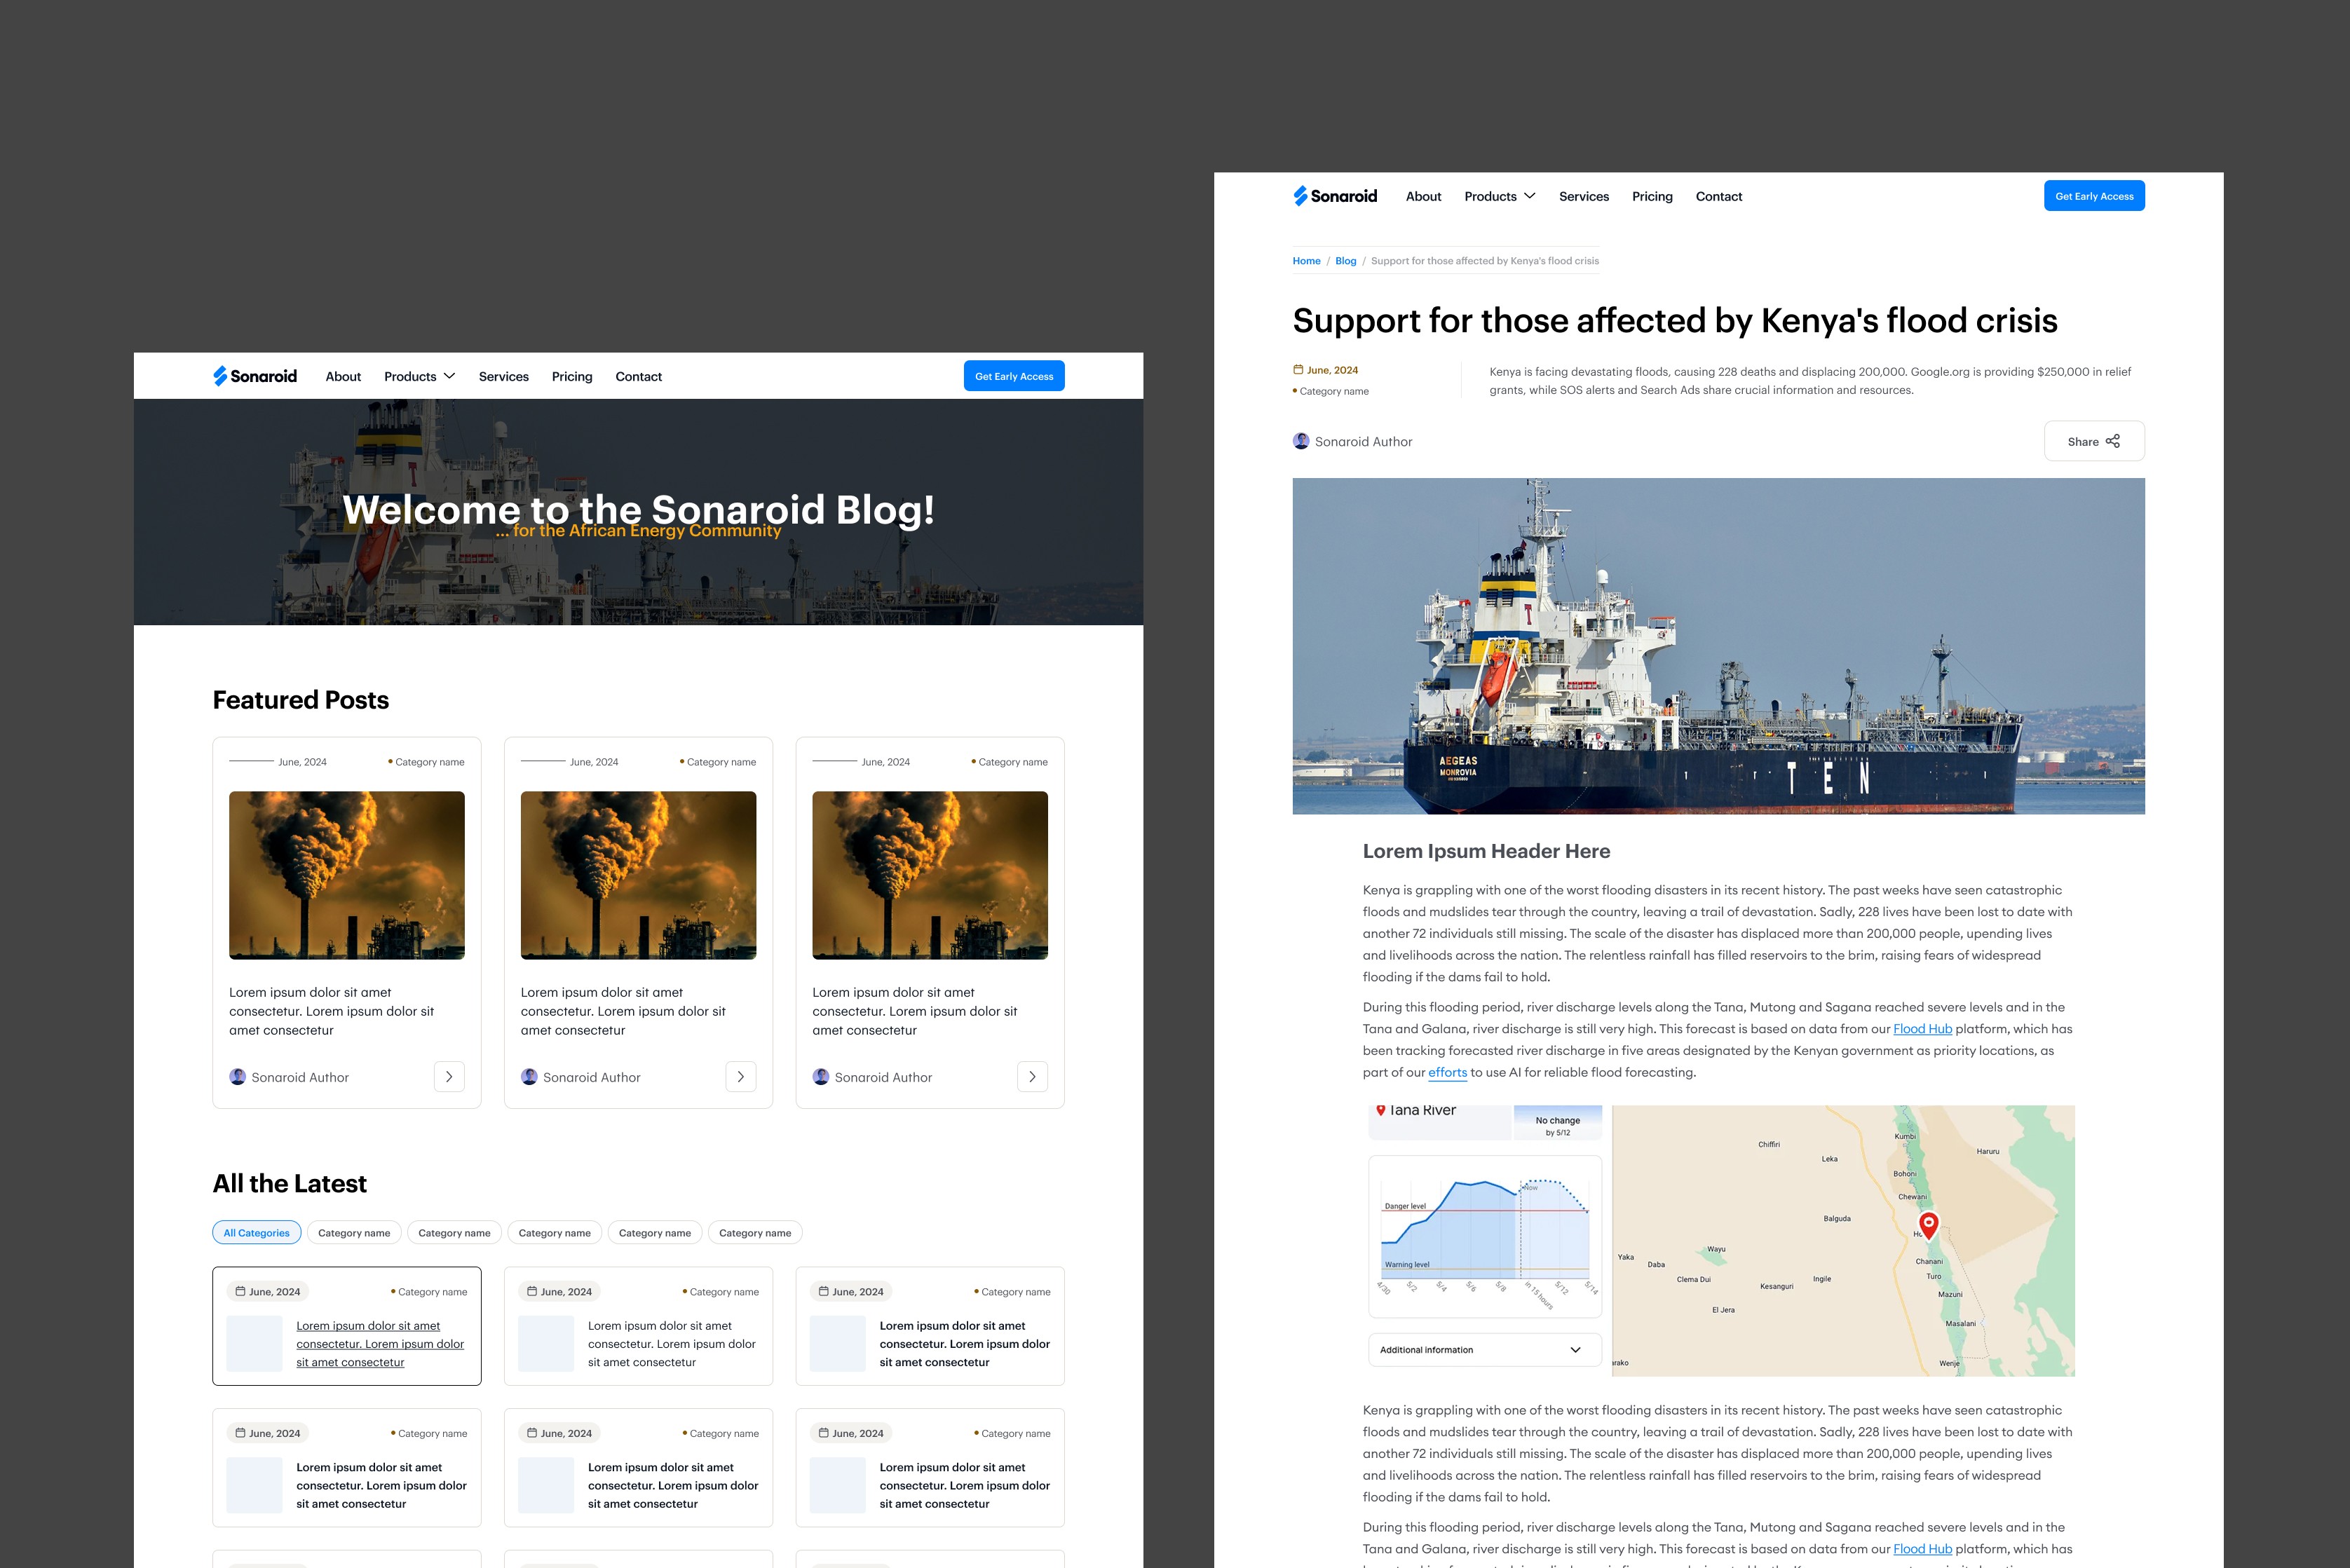
Reports Module: Repository of industry reports in downloadable formats.
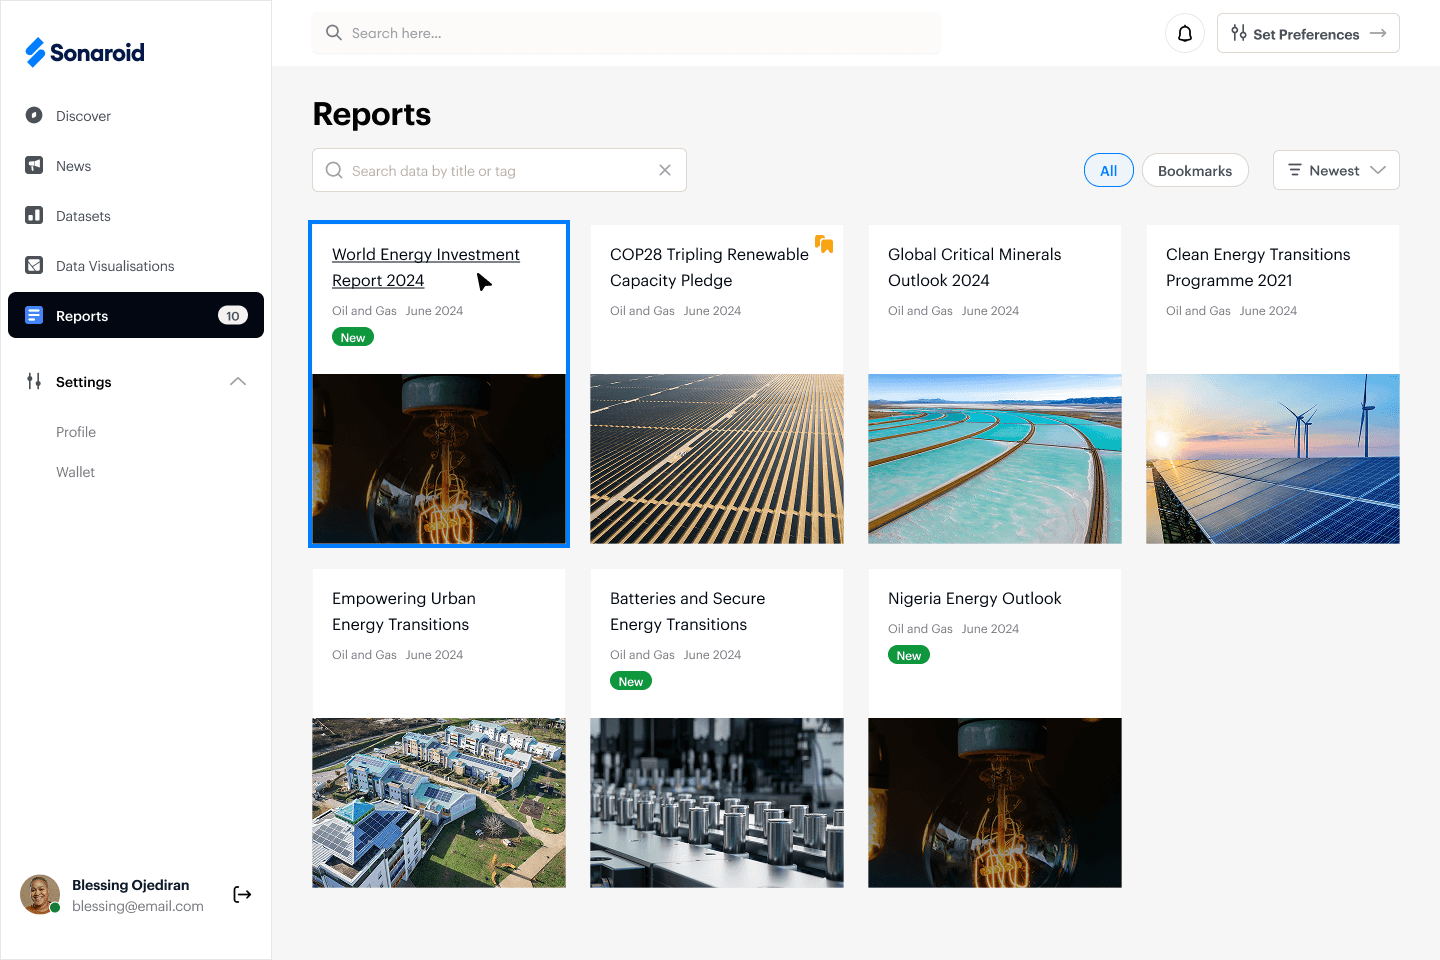
Maps/Dashboards Module: Interactive analytics tools for high-paying users.
User Management Module: Admin controls for user and data oversight.
Payment Module: Wallet system with multi-currency and crypto support.
Notification Module: Real-time updates on platform activity.
User flows were designed to ensure:
Easy registration and onboarding for contributors and consumers.
A structured process for data submission, validation, and revenue tracking.
A seamless experience for data exploration, filtering, and downloading.
3. Wireframing and Prototyping
Low-fidelity wireframes were created to outline page layouts and interactions. High-fidelity prototypes were developed using Figma to visualize the user interface.
4. Usability Testing
We conducted usability tests with industry professionals to refine the interface. Key takeaways included:
Simplifying the data submission process for contributors.
Enhancing filtering options for consumers to quickly find relevant datasets.
Improving the dashboard layout for better readability of analytics.
5. Results & Future Improvements
Following the launch, we observed:
Increased user engagement due to AI-powered recommendations.
High contributor satisfaction with a clear earnings dashboard.
Enhanced decision-making for consumers through interactive dashboards.
6. Summary & Next Steps
Sonaroid successfully addresses the challenge of accessing reliable energy data in Africa. Through a user-centric approach, we designed an intuitive platform that empowers consumers with insights while rewarding contributors for data sharing. Future iterations will further optimize user experience and scalability, as well as:
Introducing mobile support for on-the-go data access.
Expanding AI capabilities for predictive analytics.
Multi-language support to cater to a broader African audience.